unsure: Why

Assignment breakdown:
-
For Assignment 2, students will continue to use the same statistic that was used for Assignment 1. However, this time students will start by researching the contributing factors behind this statistic and gain insights into the history and future of this statistic. In this assignment, you will be distilling a narrative for "why" the current status of the statistic has come to pass.
Assignment Overview:
-
Students will continue to work with the same statistic from Assignment 1.
-
Students will project forward and plan their own weekly deliverables on their Miro boards/working journals.
-
Students will undertake research exploring the interconnected constructs that have lead to this statistic.
-
Some starting points might be :
- Why does this statistic exist in its current state in 2021?
- What are the interconnected and contributing factors behind this statistic?
- How has this statistic evolved through history?
- What is the future prospect of this statistic?
-
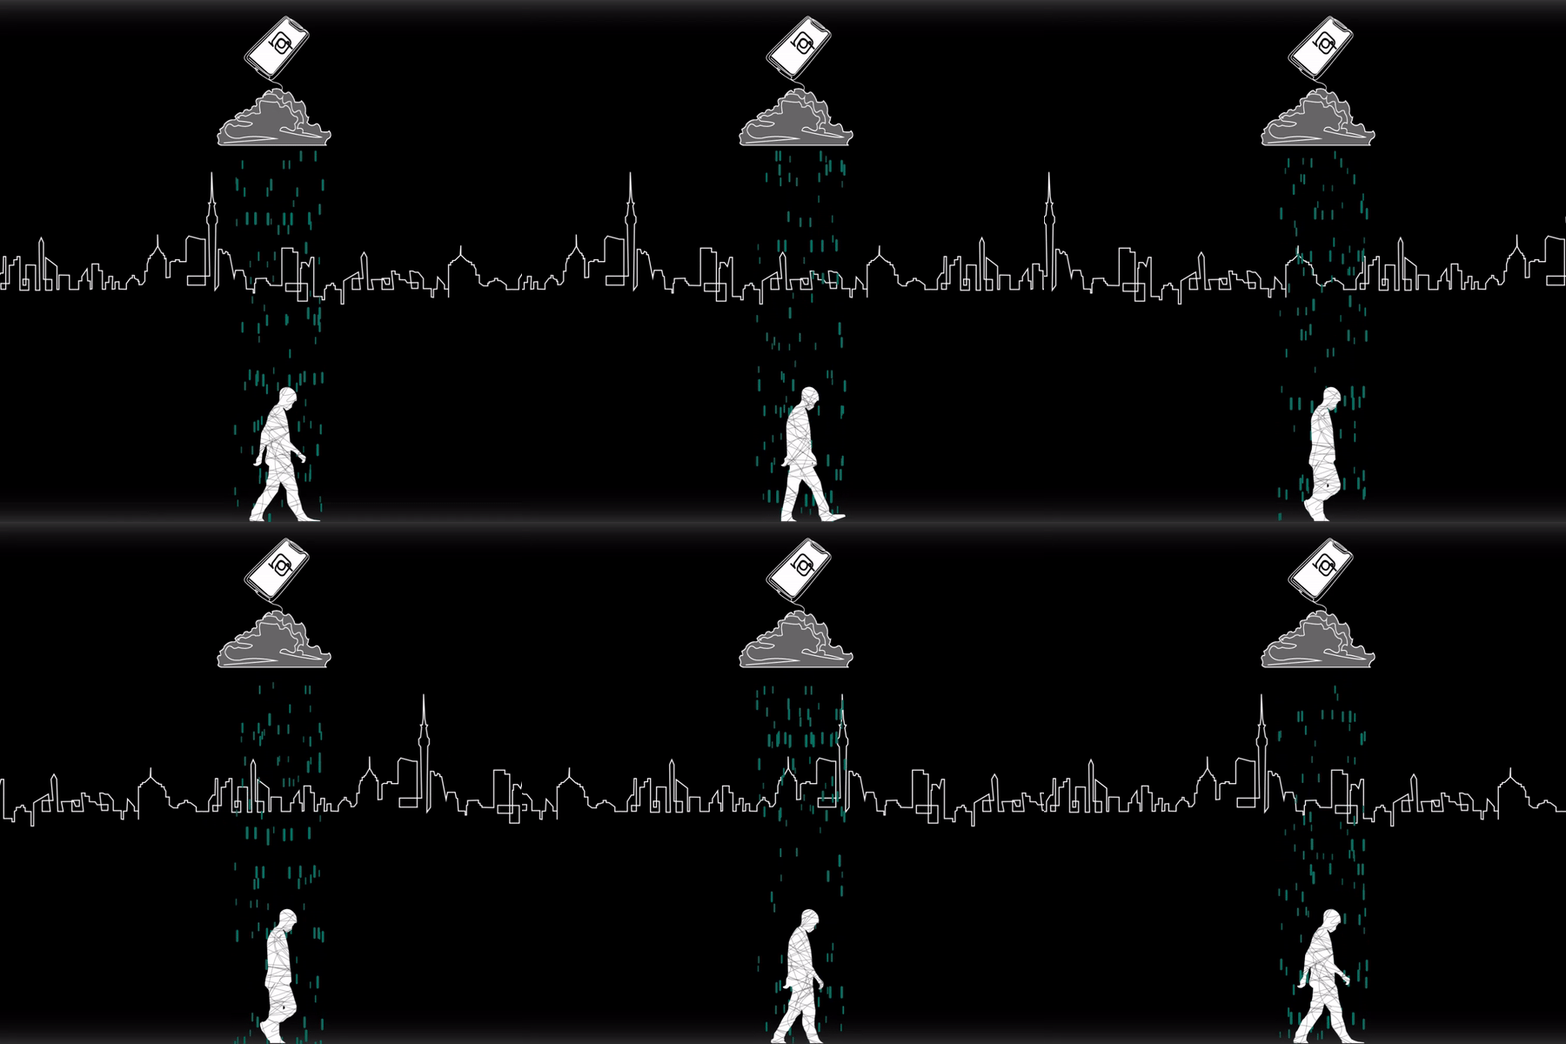
Through iterative sketching, students will construct a storyboard sequence that translates these interconnected insights into a looped state.
-
Students will explore multiple options and document their process on their blogs.
-
Students will generate custom icons and graphics using industry-standard software such as Adobe Illustrator, Photoshop or similar tools.
-
Students will translate their chosen option into a looped animated sequence through scripted means using Processing 3 (IDE).
#DES240

